HugeProfit dashboard: profit, money, and tasks on one screen
The dashboard is a one-screen summary of your business: how much you sold and earned, where your money is, and what needs your attention right now. This guide explains every block and every number.
💡 Employees see only what they're allowed to on the dashboard: without the Income information right, profit and margin are hidden; without View Balance, the “Your money” block is hidden. Set up rights in Access rights.
Top cards
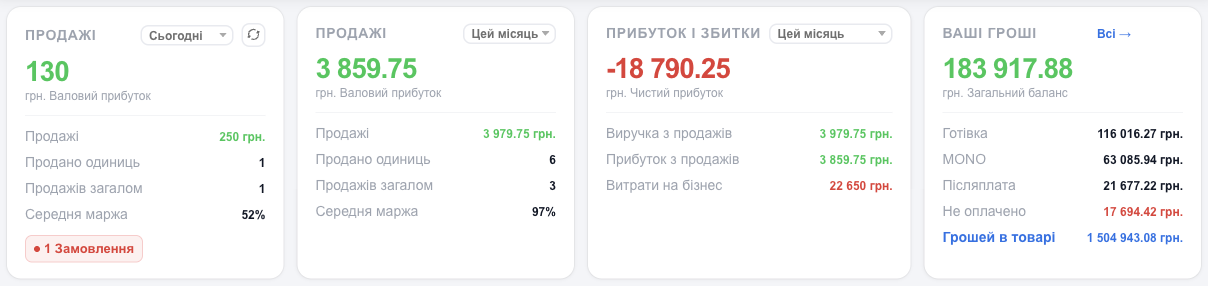
| Card | What it shows |
|---|---|
| Sales (first) | The business day: gross profit as the large number and, below it, the sales total, units sold, number of sales, and average margin. Period: Today, Yesterday, Week, This month, This Year. The ⟳ button refreshes the data. At the bottom are red badges, such as 1 Order or unread chats: click one to go to them. |
| Sales (second) | The same for a longer period: this or last month, quarter, or year. It's handy for comparing with the first card. |
| Profit and Loss | Net profit for the period: revenue from sales, profit from sales, and business expenses. |
| Your Money | The total balance of all accounts and the balance of each one. Not paid is the total of sales you haven't been paid for yet. Money in goods is the cost price of all stock in your warehouses (the same amount as Stored Goods For in Products). All → opens Transactions. |
Types of “profit”
| Metric | How it's calculated |
|---|---|
| Revenue from sales | The total of all sales for the period. |
| Gross profit / Profit from sales | The sale price minus the cost price of the products sold. If you have expense categories of the “Deduct from Profit on sales” type, those expenses are subtracted too. |
| Average margin | Profit from sales as a percentage of revenue. |
| Net profit | All income minus all business expenses (rent, salaries, advertising, and so on) for the period. |
⚠️ If your products have no cost price, profit will be overstated: HugeProfit will assume you got the products for free. Enter the cost price in the product card or receive products through shipments.
Sales chart and Need attention
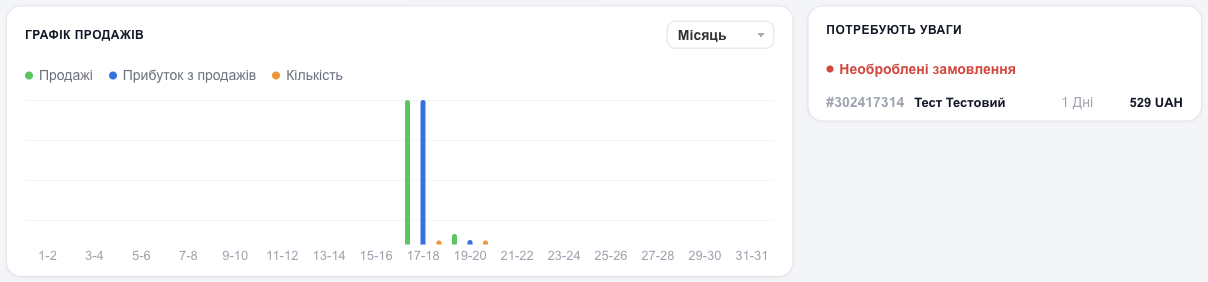
- Sales chart shows the sales total, profit from sales, and quantity by day. Period: week, month, quarter, or year.
- Need attention shows what's waiting for you: Unprocessed orders from websites and marketplaces (number, client, how long it's been waiting, amount) and Chats without reply. Click a row to open it.
Last sales and tasks
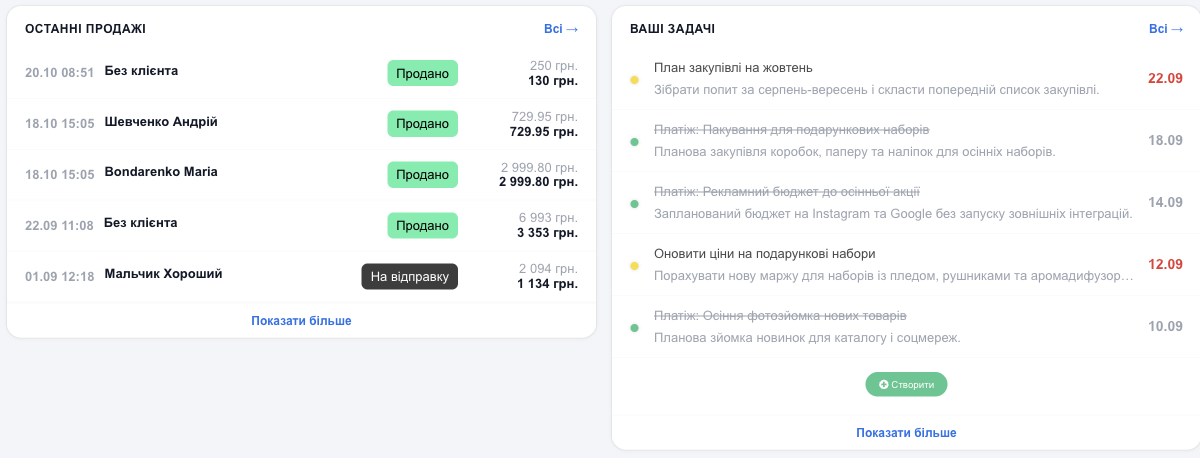
- Last sales lists sales from the last 60 days: date, client, status, amount, and profit (the smaller number on top is the sale amount, the bold one is the profit). Click a sale to open it; All → takes you to Sales.
- Your tasks lists upcoming tasks and scheduled payments from the Calendar. A red date means the task is overdue; a struck-through one means it's done. Create adds a new task.
Top products and sales channels
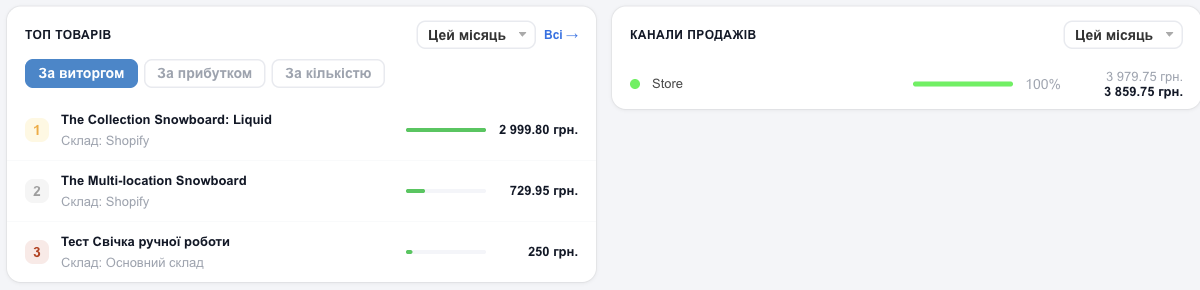
- Top products shows your best products for the period. Switch the ranking: By revenue, By profit, By quantity. Under the name is the warehouse the product was sold from.
- Sales channels shows each channel's share of sales (store, Instagram, Prom, website…): percentage, amount, and profit. You set the channel in each sale. See Sale statuses and channels.
Profit and loss, expenses by category
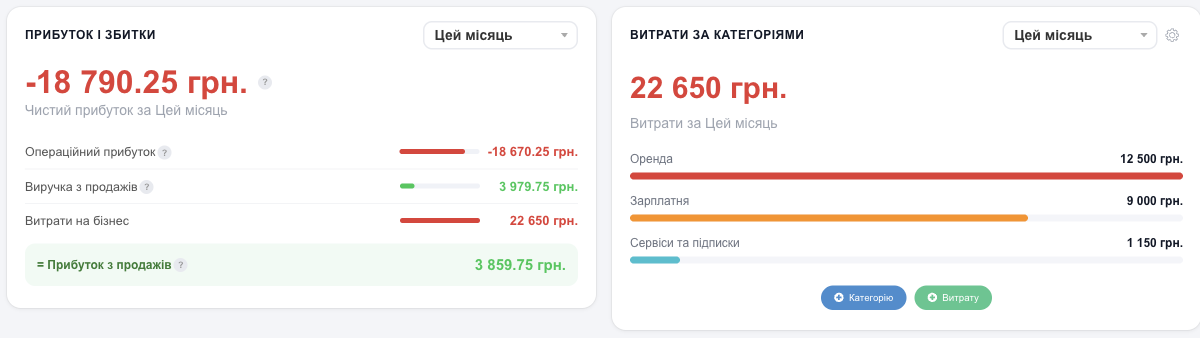
- Profit and Loss is a detailed report for the period: Net profit, Operating profit, Revenue from sales, Business Expenses, = Profit from sales. If you've scheduled expenses in the Calendar, a Forecast block appears: Expected Monthly Expenditures and Forecast net profit. Hover over ? to see how each line is calculated.
- Costs By Category shows where the money went: rent, salaries, advertising, and so on. The ⚙ gear lets you choose which categories to show. The Category and Expense buttons add a new category or expense.
Your money and month details
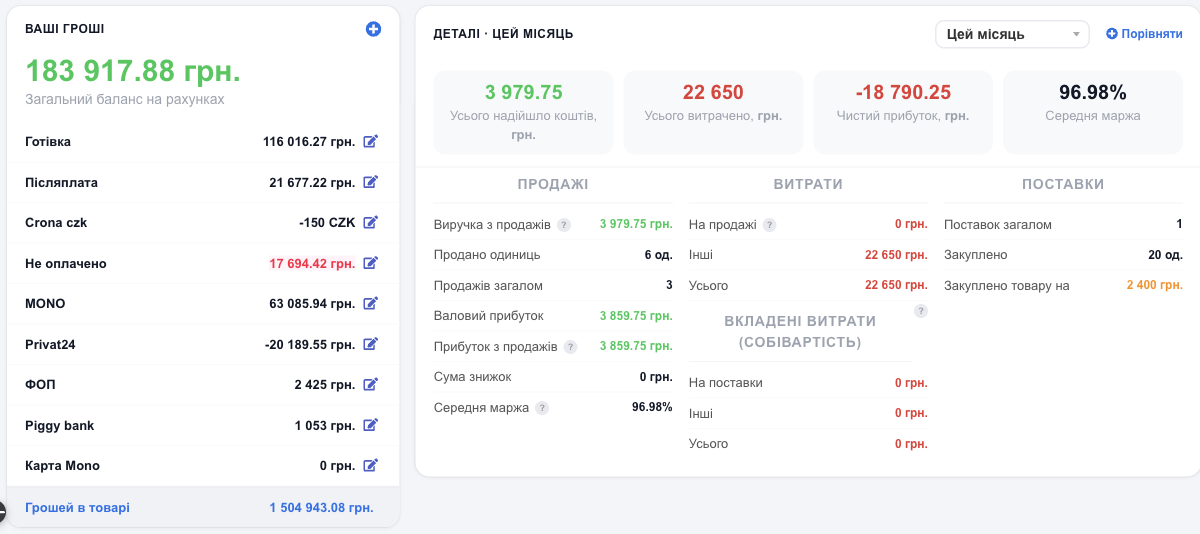
- Your Money shows the balance of each account. The ✎ pencil next to an account opens its settings (if you're allowed to edit the balance). ⊕ at the top adds a new account. At the bottom is Money in goods.
- Details is the full breakdown of the month:
- at the top: Total funds received, Total spent, Net profit, Average margin;
- Sales: revenue, units sold, number of sales, gross profit, profit from sales, total discounts;
- Expenses: On sales (subtracted from profit from sales), Other, and Embedded expenses (Cost of sales), the expenses already included in the product cost price (shipment delivery, fees, manufacturing);
- Shipments: how many shipments and units were purchased, and for what amount.
On your phone
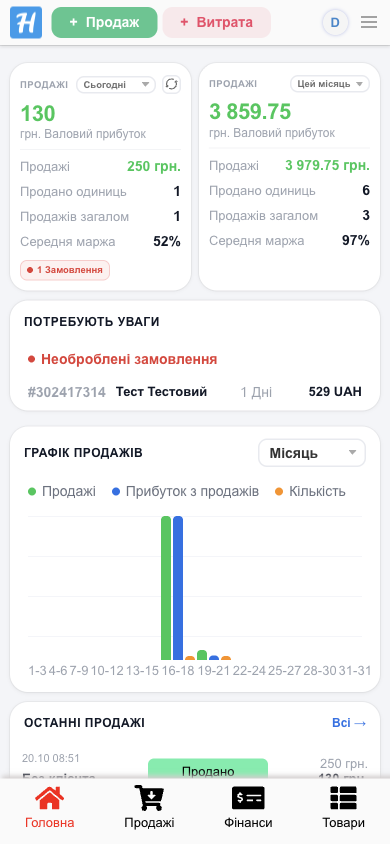
On a phone, the dashboard shows the same blocks in a single column, with Need attention right after the top cards.
FAQ
Why is my profit high but my accounts are empty?
Profit is the difference between the sale price and the cost price, while the money may have gone into buying products (see Money in goods), may be in Not paid, or may still be in transit as cash on delivery (COD).
Why is net profit negative?
Business expenses for the period exceed profit from sales. This is normal at the start of the month, when rent and salaries are already paid but sales are still coming in.
Why don't the numbers match the report?
Make sure the same period is selected. For detailed figures by product, category, and employee, see Reports.
The profit, expenses, and account balances you see on the dashboard are part of financial accounting in HugeProfit; Reports break them down by day, product, and category.